Observability stack
Prometheus, Grafana, Loki and Alertmanager monitoring 20 services across four environments. Built in-house, because the commercial quotes were a bit silly.
No dashboards, no logs, no alerts
Twenty microservices on Kubernetes and not a Grafana panel between them. The first sign something was wrong was usually a customer noticing. Datadog quoted somewhere in the £100k/year range, which wasn't happening.
So I built it ourselves. The stack is unsurprising: Prometheus and Thanos for metrics, Loki for logs, Alertmanager for paging, Grafana for everyone to actually look at. Standard pieces. The interesting bit was wiring them together so the people who needed them could actually find what they were after when something broke.
How it fits together
Enterprise Observability Stack Architecture
Metrics Flow: Services (expose /metrics) + Exporters → Prometheus (scrape) → Thanos → S3
Logs Flow: Services (stdout/stderr) → Promtail (DaemonSet collector) → Loki (aggregate)
Traces Flow: Services (OpenTelemetry instrumentation) → Tempo (distributed trace storage)
Visualization: Grafana queries Prometheus, Loki, and Tempo for unified observability (metrics + logs + traces)
Alerting: Prometheus → Alertmanager (routing + inhibition) → Teams (environment-specific channels)
Prometheus scrapes everything, hands the long tail off to Thanos in S3 so we're not paying for hot storage on data nobody queries. Loki runs in microservices mode for the same reason — logs are cheap to generate and expensive to store, so we lean on S3 and let the ingesters do the work. Alertmanager routes by environment: prod pages, dev gets a Teams message during business hours.
What people actually look at
We ended up with a couple of dozen dashboards, but most of the traffic goes to maybe five. The rest exist for the once-a-quarter question they answer perfectly. Three I'm happy with:
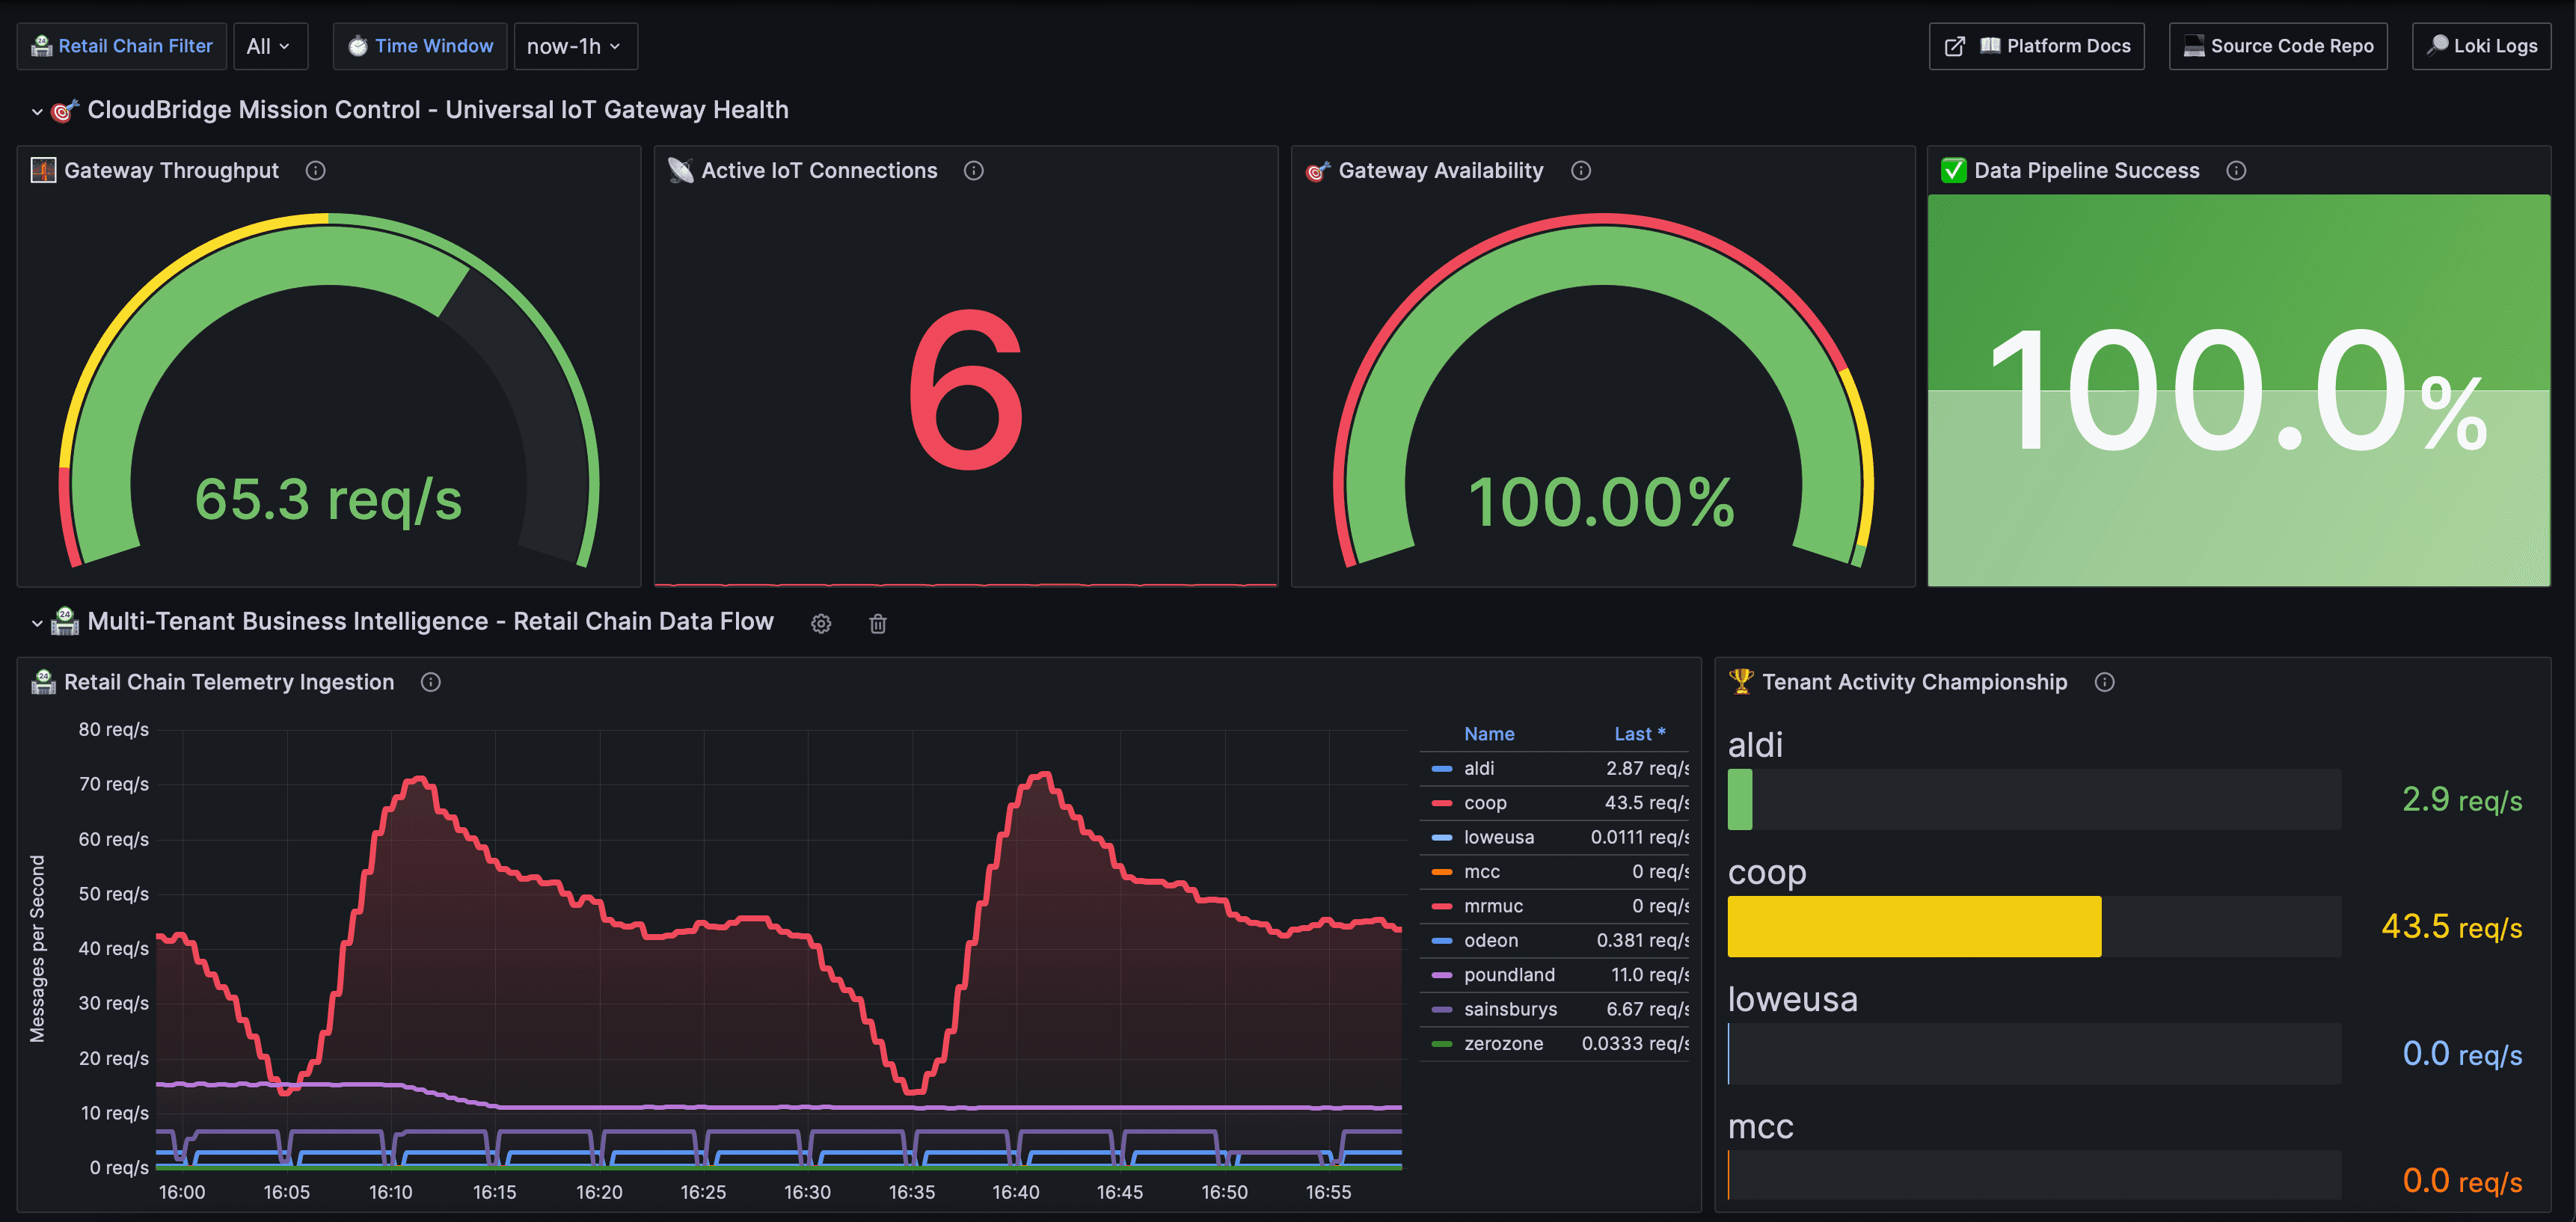
IoT Gateway throughput
Live request rate, connected devices, vendor-by-vendor performance. The first place anyone looks when an integration partner says something's broken.

Kafka consumer lag
Per-topic, per-group lag with sensible thresholds. Replaced about a dozen ad-hoc kafka-cli queries that used to live in someone's bash history.
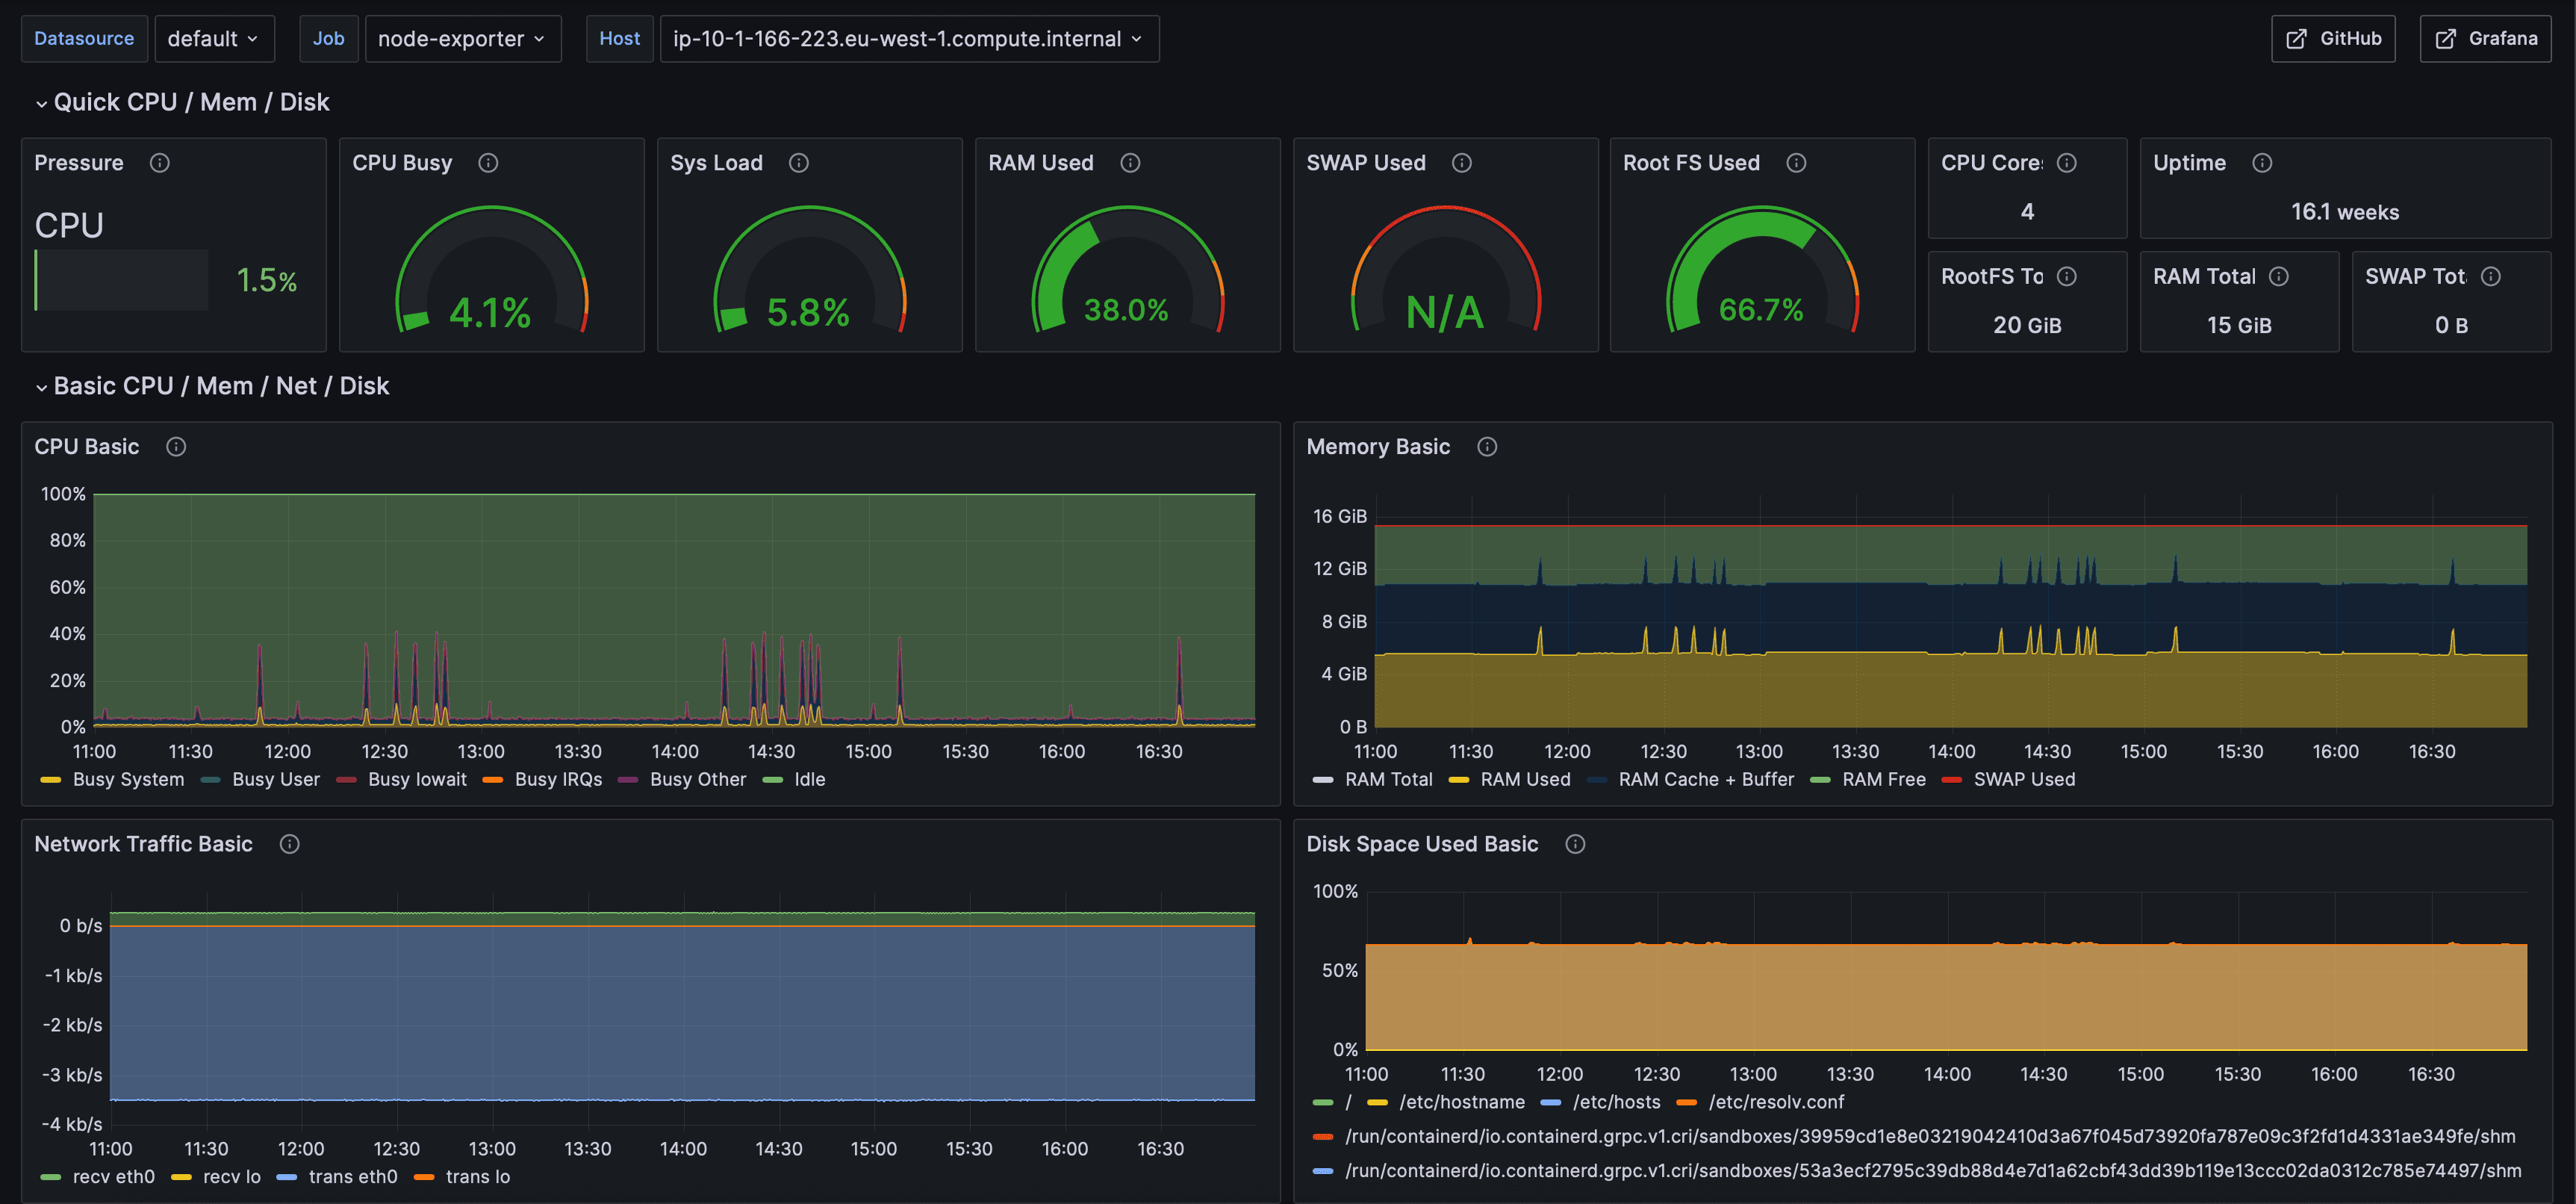
Node infrastructure
CPU, memory, disk, network. The boring one that nobody looks at until they need it, then it earns its keep.
Alerts that don't cry wolf
Every alert has to pass two tests: a human has to be able to do something about it, and the runbook has to exist before the rule ships. The runbook isn't fancy — symptom, what to check, common fixes, who to escalate to. Just enough that the on-call engineer isn't starting from zero at 3am.
Routing is by environment more than by severity. Prod fires straight to the on-call channel. Dev waits until business hours. Inhibition rules suppress the cascade of follow-on alerts when one root cause takes out a dozen things downstream — without that, the first incident I would've trained people to ignore alerts.
A few decisions worth flagging
Self-hosting was the right call here
The cost gap between "we run it" and "they run it" was an order of magnitude. We had the cluster capacity, we had Kubernetes expertise on the team, and the operational overhead has been small. I'd make the opposite call at a 3-person startup — but at our scale, the maths was obvious.
Cheap storage, expensive compute
Thanos for metrics, S3-backed Loki for logs. Both push the cold data to object storage so we're only paying premium prices for the recent stuff people actually query. This is where most homegrown stacks get expensive — getting it right early kept the bill flat as the data grew.
Dashboards as documentation
A dashboard is the answer to a recurring question. If nobody's asking it, the dashboard's clutter. I do an annual cull — open the audit log, delete anything no one's viewed in a quarter. Engineering teams accumulate dashboards the way attics accumulate boxes; both benefit from a periodic clear-out.
The numbers
services covered, every environment
running cost (vs ~£100k commercial)
alerts, every one with a runbook
dashboards (we cull the rest annually)
The cost saving is the headline, but the better outcome is harder to put on a slide: incidents now start with someone pasting a Grafana link instead of asking "is it just me?". That's the bar I was aiming for.
Thanks for reading.
If any of this resonates — or you want to dig into the parts I didn't write up — drop me a note. Always happy to talk shop.